
The Marketplace is where you browse and subscribe to additional alert sources. Each listing in the marketplace is a strategy run by someone else (or by us) that publishes trade ideas you can plug into your own bot.
Your first month is free. Every automation member gets one free month on a paid marketplace strategy — pick whichever one you want. It is one free month per customer, not one per strategy, and it does not apply to a strategy you have subscribed to before. When you are eligible, a banner appears at the top of this page and the discount is applied for you at checkout; there is no code to remember.
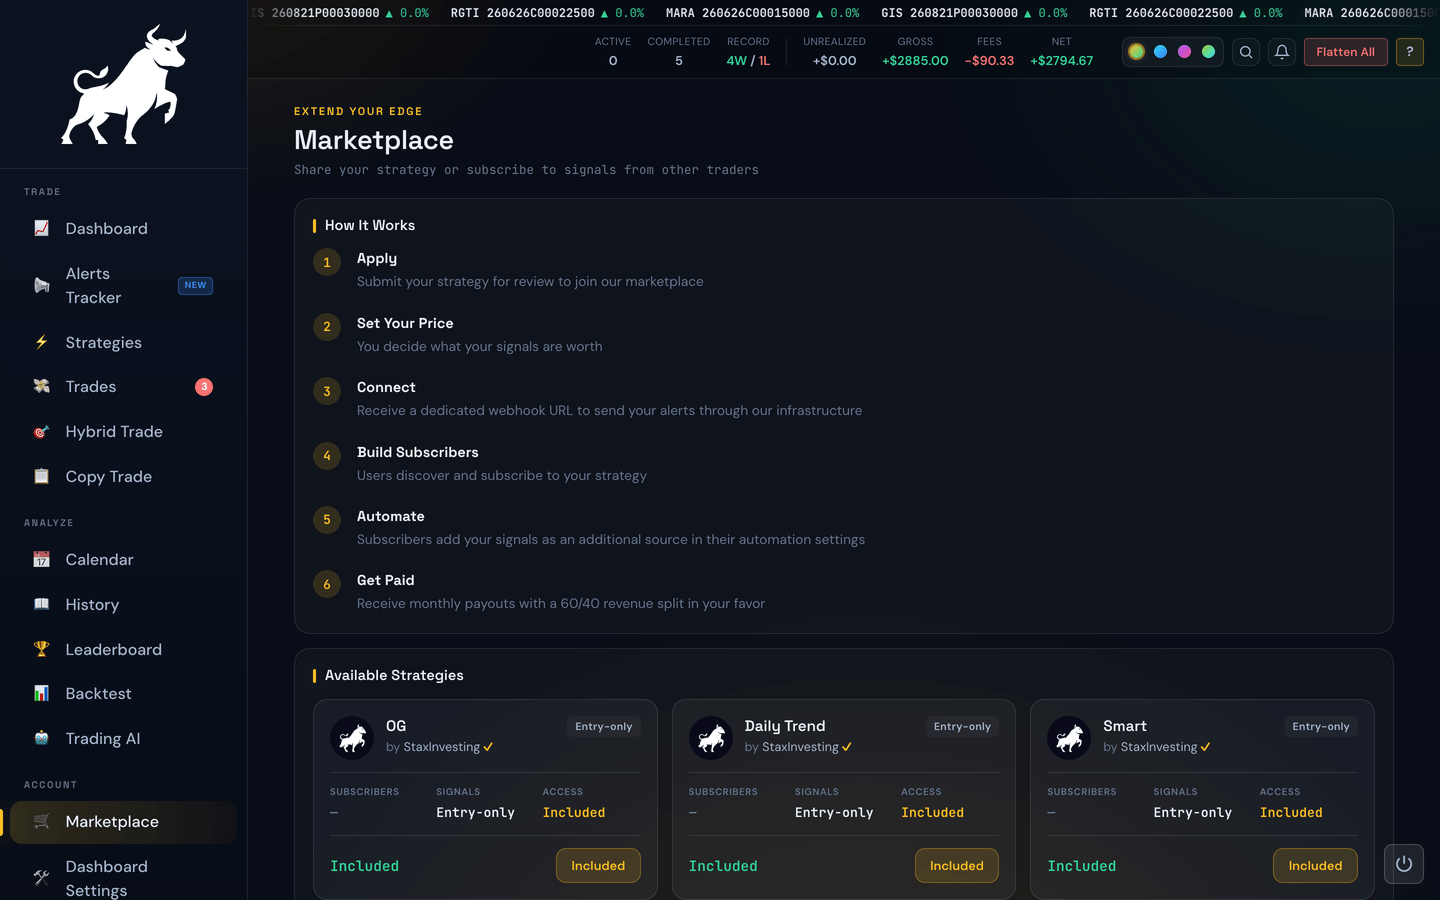
Browsing
The marketplace shows each available strategy with a short description and stats so you can decide whether to subscribe. You're not committing to anything until you click subscribe.
The page starts with a single collapsed How It Works bar — that one is for people who want to sell a strategy rather than buy one, so it stays shut until you click it and the listings sit right at the top where you can see them.
Card view vs. List view
At the top right of the page, beside the Marketplace heading, is a Cards / List toggle that changes how everything on the page is laid out. Everything you can do is available either way — pick whichever reads better for you.
- List (the default) puts each listing on a single compact row, with the names, prices and statuses lined up in columns like a table — so you can compare a lot of them at a glance.
- Cards gives each listing a full tile with its description, price and badges all on display. Best for reading about something you haven't seen before.
One toggle, the whole shelf. Your choice applies to every section on the page at once — Available Strategies, TradingView Indicators, Markets, Apps and App Integrations — so the page never ends up half tiles and half rows.
What each view shows you:
- On a strategy row you get the name, author (with whether it's run by an algorithm or a real trader), market, signal type, subscriber count and price. The description blurb is the one thing left out; open the strategy to read it. Clicking the row does the same thing as clicking a card — it opens that strategy's detail page — and the Subscribe, Unsubscribe and Edit buttons sit at the end of the row and work exactly as they do on a card.
- On an indicator, market, app or integration row you get the name, a short two-line version of the description, its status (Owned, Subscribed, Coming soon) and the price, with the Subscribe or Add market button at the end. Hover over a description that has been shortened to see the whole thing. App rows keep the publisher's name under the app title, and — like a strategy row — clicking anywhere on the row opens that app's own page, with Unsubscribe at the end of the row once you're subscribed.
The app remembers which view you picked on this device, so if you prefer Cards it'll still be Cards next time. This is remembered separately from the Live Trades and Copy Trade pages, which have their own Cards / List toggles — choosing List here doesn't change those. On a phone the rows stack neatly with a label on each value, so there's never any sideways scrolling.
Example
You're deciding between three paid strategies. In List, their prices and subscriber counts line up in two columns you can read straight down — much quicker than scrolling between three cards to compare $50/mo at 128 subscribers against $120/mo at 7. Scroll on down and the Markets and Apps sections are in the same tidy rows, so you can see at a glance that you already hold Options and Crypto and that Futures is $49/mo.
Sorting the list
In List view, click a column header to sort that section. Strategies sort by Strategy, Market, Type, Subscribers or Price. Indicators, markets and apps sort by name, Status or Price, and integrations by name or Status. The description column doesn't sort.
The first click sorts the way you're most likely to want: A to Z for names and tags, cheapest first for Price, and most popular first for Subscribers. Click the same header again to flip the order, and a third time to go back to the usual order. A small arrow (▲ or ▼) beside the header shows which column is sorted and which way.
- Each section keeps its own sort, and the app remembers them on this device.
- Strategies that come with your StaxInvesting subscription (they read Included) count as free when you sort by price.
- A listing with nothing to show in the sorted column (a dash, or "Pricing soon") always sits at the bottom, whichever way you sort.
- On a phone the column headers are hidden. The Available Strategies and Apps sections have a Sort menu above the list instead, with a ▲/▼ button to flip the direction.
Example
Click Subscribers to put the most popular strategies on top. Then click Price to line them up from free to most expensive, so you can see what $50/mo gets you next to $120/mo.
Market and Type
Every strategy carries two tags, in their own Market and Type columns in List view, and stacked in the top-right corner of each card.
Market tells you what the strategy trades. It uses the same names as the Markets section further down the page, so you can see straight away whether a strategy needs a market you already have.
- Options (blue) trades options, such as SPY or SPX calls and puts.
- Futures (amber) trades index futures, such as NQ or ES. Its alerts only place trades while a futures broker (Tradovate or Plus500) is selected.
Type tells you how the strategy sends its alerts.
- Entry-only sends the entry, and your bot handles the exit on its own using your take-profit, stop-loss or trailing-stop settings.
- Entry + Exit sends the entry and also tells your bot when to close.
- Copy Trade is a real person placing trades by hand, and your bot copies them as they happen.
The two tags don't depend on each other, so a futures strategy can be any of the three types.
Example
Nexus Quantum Pro - Futures and Nexus GridStrike are both tagged Futures, but they work differently. Nexus Quantum Pro - Futures is Entry-only: it tells you when to get into an NQ trade, and your own take-profit and stop settings decide when you get out. Nexus GridStrike is Entry + Exit: it tells your bot when to get in and when to get out.
Algorithm or real trader
Next to the author's name, every strategy also says who is actually making the calls:
- Algorithm means the alerts are fired automatically by a trading program. It follows the same rules every time and never gets tired or emotional, but it also can't use judgement when the market does something unusual.
- Real trader means a person is watching the market and calling each trade live. You get their experience and judgement, and their alerts arrive whenever they decide to act.
Today every Copy Trade strategy is run by a real trader, and every other strategy is an algorithm, but the two labels answer different questions, so they're shown separately.
Filtering strategies
Above the Available Strategies list is a row of filter buttons, so you can narrow the shelf down to exactly the kind of strategy you're looking for:
- Market — Options or Futures.
- Type — Copy Trade, Entry + Exit or Entry-only.
- Source — Algorithm or Real trader.
Each group starts on All. Pick one button in any group and the list shrinks to the strategies that match. The groups combine, so choosing a Market and a Source shows only the strategies that match both. A button only appears when at least one strategy fits it, so you'll never pick a filter that's guaranteed to come back empty.
Click Clear filters to put every group back to All. Filters work in both Cards and List view, and sorting still works on whatever is left. They reset each time you open the Marketplace, so you'll never come back to a list that is quietly missing half its strategies.
Example
You want an options strategy called by a real person, not a bot. Click Options under Market and Real trader under Source, and the list shows only strategies like DOPE Spreads and isitabuy?. Then click the Price column header to see the cheapest one first.
Subscribing
Clicking Subscribe asks you to confirm. After you confirm, that strategy becomes available as an alert source the next time you open the Strategies (or Trading Settings) page — you can then point one of your bots at it.
On a paid listing, a checkout window opens instead. Before you can pay, tick the box agreeing to the Terms of Service, the End User License Agreement and the Privacy Policy — until you do, the PayPal button sits greyed out and won't respond to a click. Tick it, click the PayPal button, and finish up in PayPal's own window.
Note
The tick never carries over from a previous purchase. Every paid subscribe asks again, because agreeing to one subscription is not agreeing to the next.
Promo codes
Your own first-month-free offer is applied automatically when you are eligible — you do not need a code for it. Separately, strategy authors sometimes hand out their own promo codes. If you have one, the checkout window for a paid strategy has a Promo code box just above the PayPal button.
Type the code in and click Apply. If it's good, the box turns into a tag showing the code and what it gets you, and the wording above updates to spell out exactly what you'll pay and when. Changed your mind? Click Remove and you're back to the normal price.
Two things worth knowing before you click the PayPal button:
- PayPal repeats the offer on its own screen. When you get to PayPal you should see something like "Free for 1 month, then $120.00 USD monthly." That's your confirmation the discount actually attached to the subscription — not just to the page you were looking at.
- A free first month means you pay nothing today. Your card or PayPal balance isn't charged at signup. The first real charge happens on the date shown in the checkout window, and if you cancel before that date you are never charged at all.
Example
Dope Investing gives you a code for his Dope Spreads strategy. You click Subscribe, type the code, and hit Apply. The tag reads FIRST MONTH FREE and the line above changes to "$0.00 due today — your first month is free. Starting September 11, 2026, you'll be billed $120.00/mo until you cancel." PayPal's screen says "Free for 1 month, then $120.00 USD monthly." You pay $0.00 now, and $120 on September 11.
A few rules that catch people out:
- A code is tied to one strategy. Dope's code works on Dope Spreads and nowhere else. Trying it on another listing tells you it's for a different strategy.
- Codes are for new subscribers. If you've subscribed to that strategy before — even if you cancelled a while back — the code won't apply. You can still subscribe at the normal price.
- One use per person. That includes your other accounts if you run more than one (see below).
- Sales-site codes are a different thing. A code from a StaxInvesting plan promotion won't work on a marketplace strategy, and vice versa.
If a code doesn't take, you'll see a short note explaining why, and the PayPal button stays right where it is at the normal price — a bad code never blocks you from subscribing.
Once you've subscribed, the code you used is listed on your Billing page alongside that strategy.
If you own more than one account
Some people run more than one account with us — a live account and a paper account, or two live accounts side by side. If that's you, a subscription follows you, not one dashboard.
Subscribe to a paid strategy on any of your accounts and every account you own gets it. You pay once. You don't subscribe again on the other one, and you're never billed twice for the same strategy.
The bill itself lives on the account you bought it from. That's the account whose Billing page shows the price, the next billing date, and the payment history, and it's the only one that can cancel. Your other accounts list the strategy too, marked Another account with a short note saying it's already covered — use Switching Between Your Accounts to hop over to the paying account if you want to cancel.
Free strategies work per account: subscribe to them on each dashboard where you want them. It's one click and costs nothing. Unsubscribing from a free strategy only removes it from the account you're on, which is handy if you want it running live but not on your paper account.
Example
You have a live account and a paper account, and you subscribe to a $50/month strategy from the live one. Both accounts can now trade its alerts. Your live account's Billing page shows the $50 charge with a Cancel button; your paper account shows the same strategy tagged Another account, with no charge and no Cancel button.
Note
Accounts are linked automatically when they share an email address or were set up together. If you own a second account that didn't pick up a paid strategy — usually because it was set up under a different email address — contact support and we'll link them for you.
Unsubscribing
If you decide a strategy isn't for you, find it in the marketplace and click Unsubscribe. Its alerts stop reaching your bot right away — you don't need to restart anything, and any bot still pointed at that source simply stops taking new trades from it.
Warning
Unsubscribe when you're flat, not while a trade from that strategy is still open. Exit alerts come down the same pipe as entry alerts, so if you unsubscribe mid-trade you won't receive the exit — leaving that position for you to close yourself from the dashboard. Check for open trades from the strategy first, or use Manual Close vs Flatten All to close them out before unsubscribing.
If a bot is left pointed at a source you've unsubscribed from, it stays on your Strategies page but stops trading. Pick a new signal source for it, or turn it off.
What subscribing does (and doesn't do)
- It does make the strategy's alerts available to your bot.
- It does not automatically start trading them — you still have to attach the source to one of your strategies and turn that strategy on.
- It does not charge you extra (unless the listing itself is a paid subscription, in which case the listing will tell you so up front).
- If the listing is a paid one, it does apply to every account you own, not just the one you're looking at. See If you own more than one account above.
- If the paid listing has a private Discord alert channel, it does get you into it — but only once you've connected your Discord account. See Discord Alert Access.
Tip
A new subscription is a great candidate for a backtest before you flip it on live. Subscribe, run a backtest against its historical alerts, and let the past results inform your decision.
If you publish a strategy of your own
Anyone can put a strategy on the marketplace and charge for it. At the very top of the page is a slim How It Works bar — click it and it drops open to show the six steps, then click again to tuck it away. It stays however you left it the next time you come back, so if you're here to shop it's out of your way for good. The steps are:
- Apply. Submit your strategy for review. We check it's a real, tradeable strategy before it goes on the shelf.
- Set your price. You decide what your signals are worth — anything from free to a few hundred a month.
- Connect. You get your own private web address (a "webhook") to send your alerts to. Whatever you use to generate signals — TradingView, a spreadsheet, your own software — points at that address, and we take it from there.
- Build subscribers. Your listing appears in the marketplace for every member to find and subscribe to.
- Automate. Subscribers add your signals as an extra alert source in their own settings, and their bot trades them automatically. You never touch anyone else's account.
- Get paid. Payouts land monthly on a 60/40 split in your favour. PayPal's processing fee comes off each payment first, then you keep 60% of what's left. Your month-by-month statement is in Your Creator Earnings.
Example
you list your strategy at $50 a month and 20 people subscribe. That's $1,000 collected each month. PayPal keeps about $2.24 of each $50 payment, leaving $47.76 — and 60% of that is $28.66 per subscriber, or about $573 a month for you.
Any listing you own is tagged YOURS in the marketplace and carries an Edit button, so you can change its name, description, and price yourself. See Managing Your Strategy Listing.
Opening a strategy detail page
Click any strategy in the marketplace list to open its detail page. This is where you research a strategy in depth before subscribing — and revisit it after you've subscribed to keep tabs on how it's been doing.
The detail page is built around three areas:
Stats cards at the top summarize the strategy's track record:
- Win Rate — percentage of historical alerts that closed profitably.
- Total P&L — running total over the period the page is showing.
- Profit Factor — dollars made per dollar lost.
- Avg Win and Avg Loss — typical size of a winner and a loser.
- Best Trade and Worst Trade.
- Win Streak and Loss Streak — longest consecutive runs.
- Total Trades — how many alerts the strategy has published.

Equity curve — a chart of the strategy's cumulative P&L over time. The curve reacts to the inputs described below, so the same strategy can look different depending on how you would have traded it.
Trade history — every alert the strategy has ever published, split into two sections:
- Open Positions — alerts that haven't closed yet, with live prices, session high/low, and a running P&L %.
- Historical — the full closed-trade log with entry, exit, days-to-expiration (DTE), and an outcome pill.
Click any spread-type pill to expand a row and see the per-leg breakdown — same convention as the rest of the portal.
A small notes icon appears next to any trade the publisher wrote a Trade Thesis for — in either table. Click it to read their note on why they took that trade, no subscription required.
Copy These Settings (the setup code)
Subscribing gets you a strategy's alerts. It does not tell you how the person who publishes them actually trades those alerts — how much they put on, where they take profit, when they stop for the day. That gap is where most disappointment comes from: two people follow the same caller, size their trades differently, and end the month with completely different results.
Many listings now close that gap with a Copy These Settings panel near the top of the detail page. It shows a short setup code — something like STAX-7A67 — that the publisher minted from the strategy they run themselves.
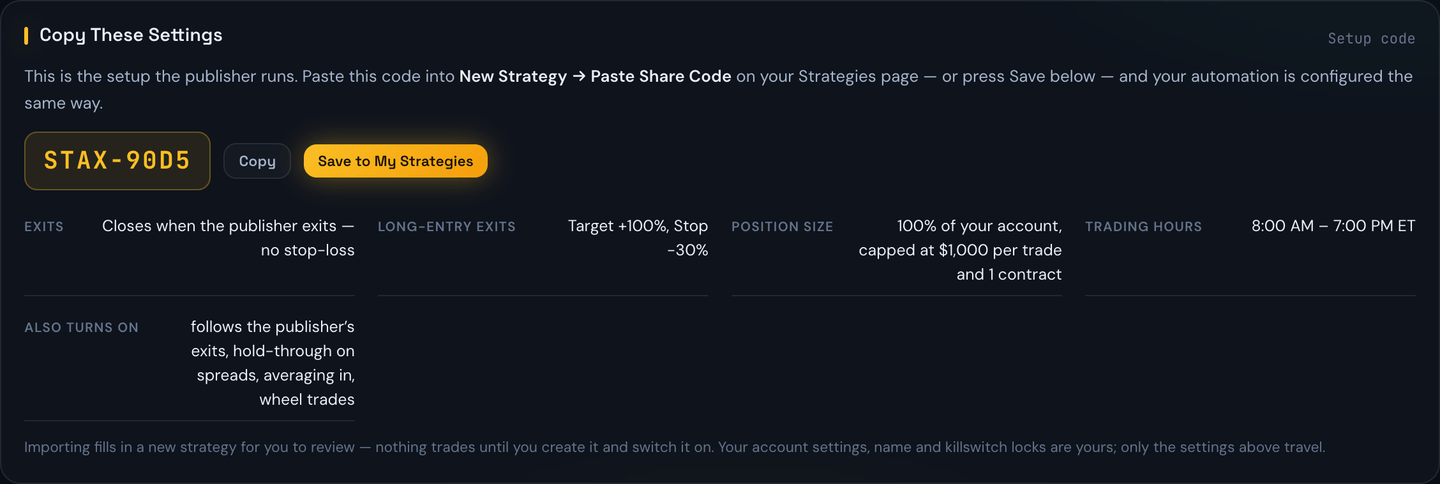
Underneath the code, the page spells out in plain English what that code contains before you use it. Typically:
- Exits — the profit target and stop-loss, or the list of exit legs if they scale out.
- Trailing stop — whether one is on, and how far the trade has to run before it arms.
- Position size — a percentage of your account, or a fixed dollar amount per trade.
- Trades per day and Open at once — the daily limits.
- Trading hours — the window their bot is allowed to enter in.
- Daily killswitch — the profit or loss that stops them for the day, if they use one.
- Also turns on — extras like following the publisher's exits, limit entries, or averaging in.
Two buttons sit next to the code:
- Copy puts the code on your clipboard. Paste it into New Strategy → Paste Share Code on your Strategies page whenever you like.
- Save to My Strategies does it for you — it opens the New Strategy panel with every one of those settings already filled in and the strategy named after the listing.
Either way, nothing trades until you say so. The strategy arrives turned off and sitting in front of you for review. Change anything you disagree with — the position size especially — then press Create Strategy and flip it on when you're ready.
Example
You've just subscribed to Dope Spreads. Its listing shows the setup code
DOPE-3B12, and the panel underneath says Exits: 2 exit legs (50% at +25%, 50% at +100%) · Position size: 5% of your account · Trades per day: Up to 3 · Trading hours: 9:40 AM – 3:45 PM ET. You click Save to My Strategies, look it over, decide 5% is more than you want to risk while you're getting to know the strategy, drop it to 2%, and create it.
Warning
A setup code carries the publisher's risk appetite, not yours. Their 5% per trade and their $500 daily stop are sized to their account and their nerve. Read the summary before you import it, and treat the position size as the first thing to adjust — see I Want to Start Safer if you'd rather ease in.
Note
Your own account settings never travel in a setup code. Your broker, your account-wide killswitch, your paper/live choice and your other strategies are all untouched — the code only fills in the one new strategy.
Not every listing has one. If a strategy shows no setup code, its publisher simply hasn't published one yet, and you configure your bot the usual way on the Strategies page.
When a listing offers two setups
Some publishers run the same signals more than one way, and the most common split is time of day — a daytime configuration with regular-session hours and one size, and a separate overnight one with different hours and usually a smaller size.
When that's the case you'll see two panels instead of one, each headed with the publisher's own name for it — Day Setup and Night Setup, say. Each panel has its own code, its own plain-English summary, and its own Save to My Strategies button.
You are not being asked to choose one. They're separate setups, so you can take either, or take both — each one becomes its own strategy on your Strategies page, and the setup's name is added to the strategy name so you can tell them apart at a glance.
Example
Nexus Quantum Pro's listing shows a Day Setup (
NEXUS-3B12, 9:40 AM – 3:45 PM ET, 5% per trade) and a Night Setup (NEXUS-8C47, 6:00 PM – 2:00 AM ET, 2% per trade). You only want to trade while you're awake, so you press Save to My Strategies on the Day panel and ignore the other. A month later you come back and add the night one too — it arrives as a second strategy called "Nexus Quantum Pro Night", switched off, and your day strategy carries on untouched.
Warning
Taking both setups means both can be in the market. Their position sizes and daily limits are counted separately, so a 5% day setup and a 2% night setup is not a 5% commitment — check your own account-wide killswitch before you run both. See Killswitch for where that limit lives.
When a publisher updates their setup
A setup code is a snapshot, not a live link. The code you copied in July still hands out July's settings, for good — even after its publisher has moved on to trading something different. Left alone, that means you'd quietly drift out of step with the very person you subscribed to follow, and never know it.
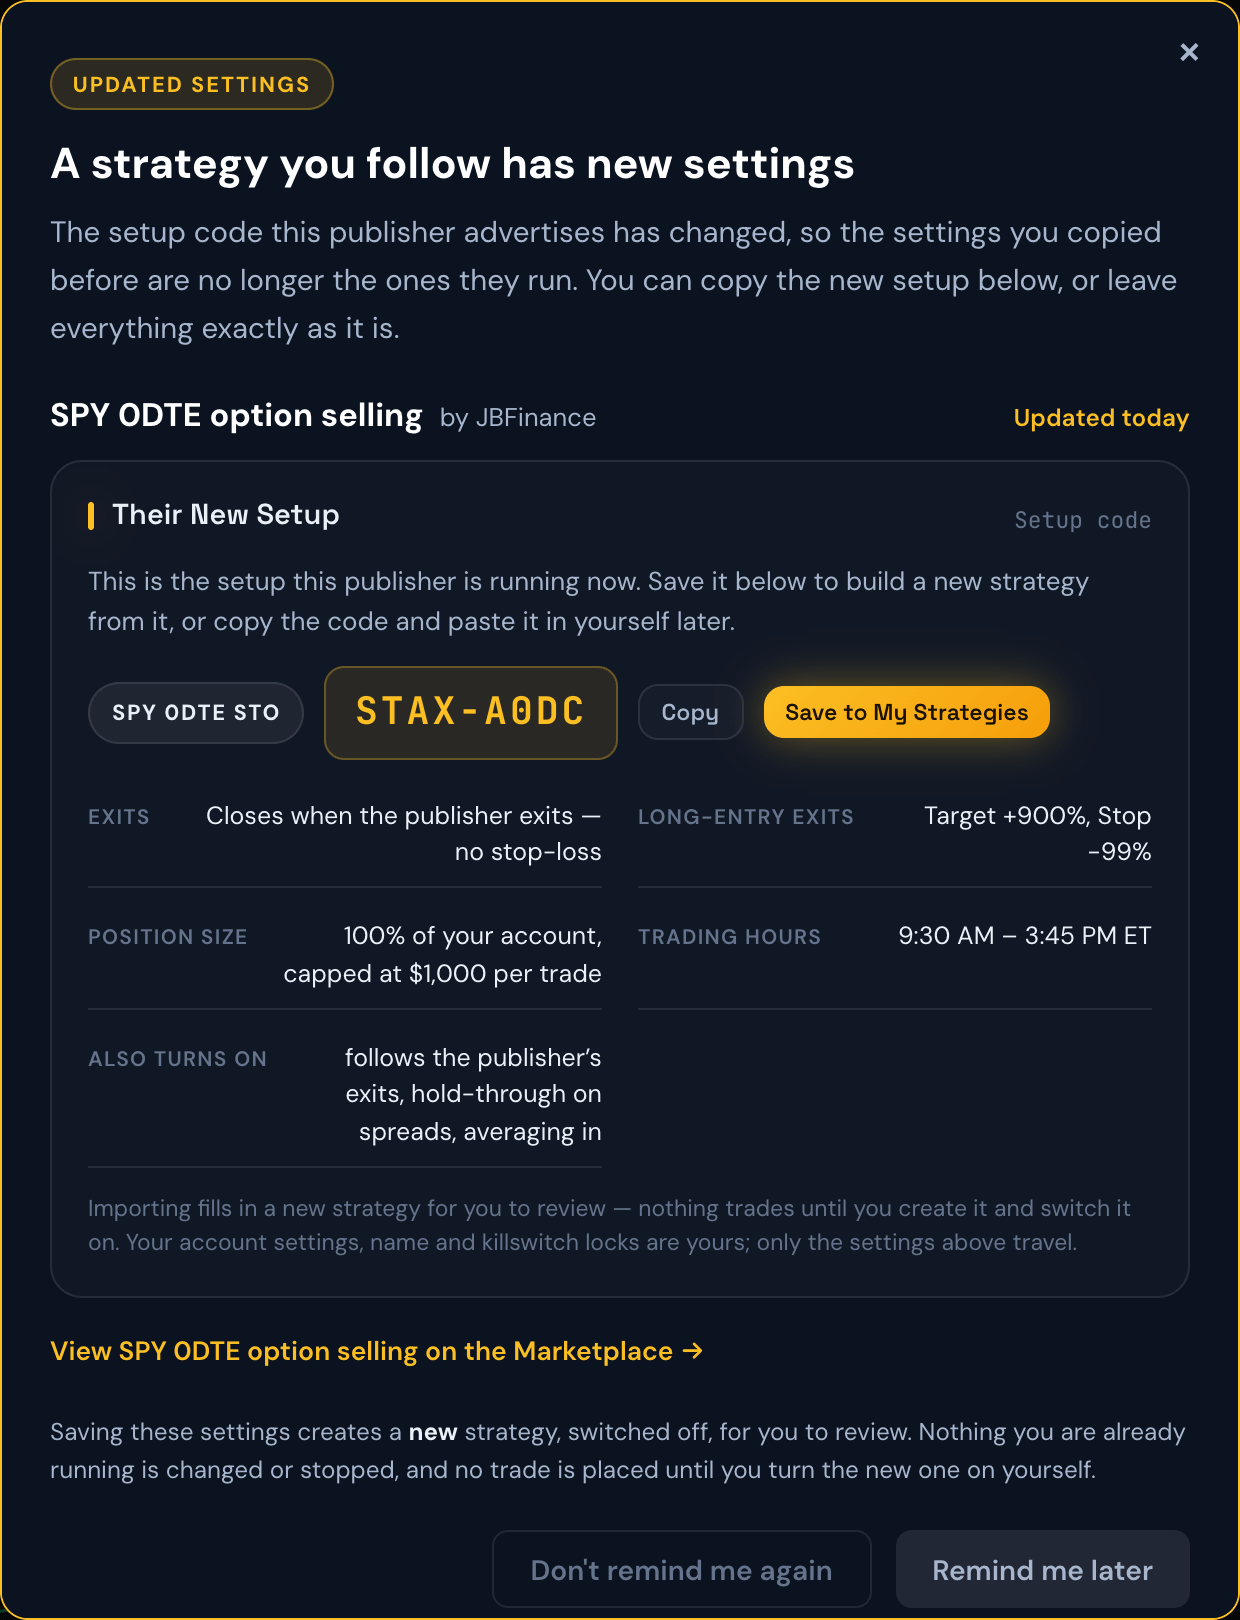
So when a publisher publishes a new setup code for a strategy you're subscribed to, we tell you. The next time you log in you'll see a short pop-up naming the strategy, when the setup changed, and exactly what the new code contains — the same plain-English summary you'd get on the listing. If they've added a second setup alongside the one you already have, the pop-up shows you only the new one; the code you're already running isn't repeated back at you. From there you can:
- Save to My Strategies — builds a new strategy from the updated settings, switched off, for you to review.
- View on the Marketplace — takes you to the listing to look at the strategy's recent results before you decide.
- Remind me later — closes it. It'll come back next time you log in.
- Don't remind me again — closes it for good for that particular update.
Example
You've been running Dope Spreads with the settings from
DOPE-3B12since June. In August its publisher widens the stop-loss and adds a third exit leg, mints a fresh code, and puts it on the listing. Next time you log in, a pop-up tells you Dope Spreads — Updated 2 days ago, shows you that the stop moved from -50% to -65% and that there are now three exit legs instead of two, and offers to set it up for you. Your existing strategy keeps running the old settings the whole time.
Note
This never changes anything on its own. Your existing strategies keep running exactly as they are, and saving the new setup creates a separate strategy that is switched off until you turn it on. Nothing is closed, stopped, or resized behind your back.
Tip
You don't have to take every update. If the settings you're running suit you and are making money, "Don't remind me again" is a perfectly good answer. The notice exists so the choice is yours, not so you feel obliged to chase it.
You'll only ever hear about this for strategies you're actually subscribed to, and only when a code genuinely changes — a publisher editing their price or description doesn't trigger anything, and neither does renaming a setup or taking one off their listing.
Paper-traded history
A few strategies were forward-tested on a paper trading account before their author started trading them with real money, and that early stretch is included in the track record so you can see the whole story. Those trades are tagged with a pink PAPER pill next to their WIN or LOSS, and a note above the stats cards tells you how many there are and the date real-money trading began.
The signals and the option prices in a paper stretch are real — what's missing is a real broker filling the order. In live trading you can get a slightly worse price than the one you saw, so treat a paper-heavy record as a promising sign rather than a finished one, and give more weight to the trades taken after the author went live.
Example
A strategy shows 26 trades. The banner reads "21 of the 26 trades below are marked PAPER… Live broker execution began Jul 20, 2026." That tells you the last handful of trades are the real-money ones — worth scrolling to before you subscribe.
Trades called under another name (the CHALLENGE tag)
Several of our callers built their following in the Shot Caller Challenge before they ever opened a paid listing. Where that's the case, the listing can publish both records together, so the page shows the whole story rather than starting from zero on the day the listing opened.
Those earlier trades are marked with a quiet CHALLENGE tag beside the ticker. Hover it and it tells you the same thing: this trade was called before the listing existed, under that event's rules.
It's deliberately quieter than the WIN and LOSS pills, because it isn't an outcome — it tells you where a trade was called, not how it turned out. The stats cards, the equity curve and the win rate all include these trades, which is the point of showing them.
Weigh them slightly differently, though. Challenge trades were called under competition rules — a cap on contracts, and no subscribers riding along — so they aren't quite the same as a trade you'd have been able to take as a paying subscriber. The tag is there so you can count them for what they are instead of having to guess.
Example
A caller's listing used to show 3 trades, because that's all it had published under its own name. It now shows 13 — the 10 Challenge calls tagged, the 3 listing trades plain — with the win rate and equity curve computed across all of them.
Note
You'll see the same tag on the same trades on the Alerts Tracker page. The two pages read from one record, so they can never disagree about which trades a caller made where.
Strategies that sell options (credit strategies)
Some strategies make money by selling options instead of buying them — think credit spreads, iron condors, or selling a call or put outright. For these, the trader collects money up front (the credit) and profits by buying the position back for less than they collected.
That flips what "good" looks like on the price: the price going DOWN is the win. The detail page knows this and scores every trade from the seller's side, so the P&L, win/loss pills, and best/worst numbers always reflect what the strategy actually made.
Example
A strategy sells a SOFI call for $0.40 and later buys it back for $0.07. The option's price fell — and that's a win of $33 per contract, because the seller kept most of the $40 credit they collected up front.
The WHEEL pill
Some credit strategies deliberately let a position get assigned rather than closing it — a cash-secured put that turns into owned shares, or a covered call that gets the shares called away. Those trades show a blue WHEEL pill instead of WIN or LOSS, because neither word really fits: nothing went wrong, the trade just finished by converting into stock. See Allow Wheel for how that works and how to opt in or out.
The P&L shown on a WHEEL row is the option premium only — what the strategy collected for selling the contract, which it keeps in full because the option was never bought back. You won't see a scary five-figure "loss" for shares the strategy simply took delivery of.
The shares themselves are tracked separately, in a Wheel holdings table further down the listing, and what they eventually make or lose is counted in the strategy's Total P&L. See Wheel Holdings for how to read it.
Example
A strategy sells a BULL $5.50 covered call for $0.18 and the shares get called away. The row shows WHEEL with a $18 gain — the premium collected. What the shares themselves made shows up in the wheel holdings table and in the "shares" half of Total P&L.
Note
When you're comparing a wheel-heavy strategy against a pure spread strategy, look at the split under Total P&L. A wheel strategy often earns most of its money on the stock, with option premium as a steadier trickle on top.
As traded, or sized to your money
A listing can show its record two ways, and there's a switch at the top of the panel to move between them.
As traded is what the trader actually did. If they told us how many contracts they bought or sold on each trade, this is their real record — the same numbers they see on their own performance page. Nothing here depends on how much money you have.
Simulate my size answers a different question: what would this have done with my money behind it? Every trade gets re-sized to what you could have taken on, and the stats, the chart and every row recalculate to match.
What that second view asks you for depends on the strategy. One that buys options asks how much you'd put behind each trade. One that sells them asks for your whole account, because a sold position ties up cash until it closes — see the two sections below.
Listings open on As traded when the trader has been stating their size. Otherwise they open on the simulator, because there's no real size to show. Whichever you pick is remembered for that strategy.
Example
A trader sells one contract and makes $120. Under As traded the row reads +$120, because that's what happened. Switch to Simulate my size with a bigger account behind it and the same row might read +$600, because you could have carried five contracts instead of one.
Max Capital Per Trade (strategies that buy options)
For a strategy that buys options, Simulate my size asks one question: how much would you put behind each alert? That's the Max Capital Per Trade input. Every number on the page recalculates instantly when you change it, and the setting is remembered separately for each strategy.
Example
A strategy's historical equity curve looks great at $1,000 per trade. Bump it to $5,000 and you'll see how that same track record would have played out with more capital behind every alert — bigger wins, bigger losses, and a bigger drawdown line.
The Account Simulator (strategies that sell options)
Strategies that sell options get a different set of controls, because a per-trade budget can't describe them honestly.
When you buy an option, what it costs is what you paid, and one trade rarely affects the next. When you sell one, the premium is money coming in — and the position ties up cash until it closes. A cash-secured put needs the full strike, times 100, held aside the whole time: one contract on a $50 strike is $5,000, and it stays locked up until the trade is over. What limits you isn't a number you picked per trade. It's your account, spread across everything open at once.
So these listings ask for two things instead:
- Account size — what you'd be starting with.
- Max contracts per trade — your own ceiling, so one position can't swallow the account.
Then the page walks the strategy's whole record from the oldest alert to the newest, taking each trade only if the money was actually free at that moment, and shows you what the account would be worth at the end.
Example
You start with $25,000 and cap yourself at 1 contract per trade. The strategy sells a put on a $50 strike — that's $5,000 held aside — leaving $20,000. Four more alerts fire before the first one closes, and each takes another $5,000. The sixth has nothing left to work with, so it's skipped, and the page tells you so.
Tip
Raising Max contracts per trade doesn't always mean more profit. A cap of 5 means the very first alert takes five contracts and ties up $25,000 all at once — so the next four alerts get skipped entirely. On a strategy that sells, one contract per trade usually follows far more of the record than five does. Try both and watch the Alerts taken figure.
Reading the account result
- Ending balance — what the account would be worth once every position closed, and the gain or loss in dollars and percent.
- Most capital tied up — the high-water mark, and how many positions were open at once when it happened.
- Alerts taken — how much of the record your account could actually have followed.
Two warnings can appear, and both are worth taking seriously:
Some alerts couldn't be taken. Your account was too small to fund everything the strategy called. The figures describe only the trades you could have entered — so a good-looking result here is a result on part of the record.
This account would have been wiped out. The balance reached zero partway through. Trading stops there, because in reality it would, and nothing after that date is counted. In both cases the page works out the smallest starting balance that would have made it through, and offers a button to plug that number in.
Warning
A strategy can have an excellent win rate and still wipe out a small account. Selling options means occasional losses far bigger than the premium collected, and the account has to be able to absorb one. If the simulator says your balance doesn't survive, that is the single most important thing on the page.
Note
This is an estimate for comparison, not a margin quote. It uses the full strike for a sold single option and the distance between strikes for a spread. Your broker decides what it actually requires, and it may allow more or demand more.
Trades with no size on them
A trade the strategy called before it started publishing position sizes is marked size not stated and counted as one contract. It's a caveat on that row's numbers, not a problem with the trade — we just don't know how big it was, so we assume the smallest honest answer rather than guessing upward.
Min Win % Threshold (entry-only sources)
Some strategies publish entry-only alerts — meaning the alert says "buy this" but never publishes a corresponding exit. For these strategies the detail page can't always tell whether an old alert was a winner or a loser. That's where the Min Win % input comes in: you tell the page the minimum profit a trade had to reach to count as a win. Anything that hit that bar is a WIN; anything that didn't is a LOSS; alerts that haven't fully played out yet are POTENTIAL. See the Signal Sources topic for more on entry-only vs entry+exit.
The MAX badge and POTENTIAL pill
On entry-only strategies you'll see two extra markings:
- A MAX badge on a row's P&L means the number shown is the best the trade ever reached (the session high), not necessarily what you would have walked away with. It's a "best-case" reference point.
- A POTENTIAL outcome pill marks trades that haven't met your Min Win % threshold or your equivalent of a final answer — they're still open-ended.
Futures strategies look different
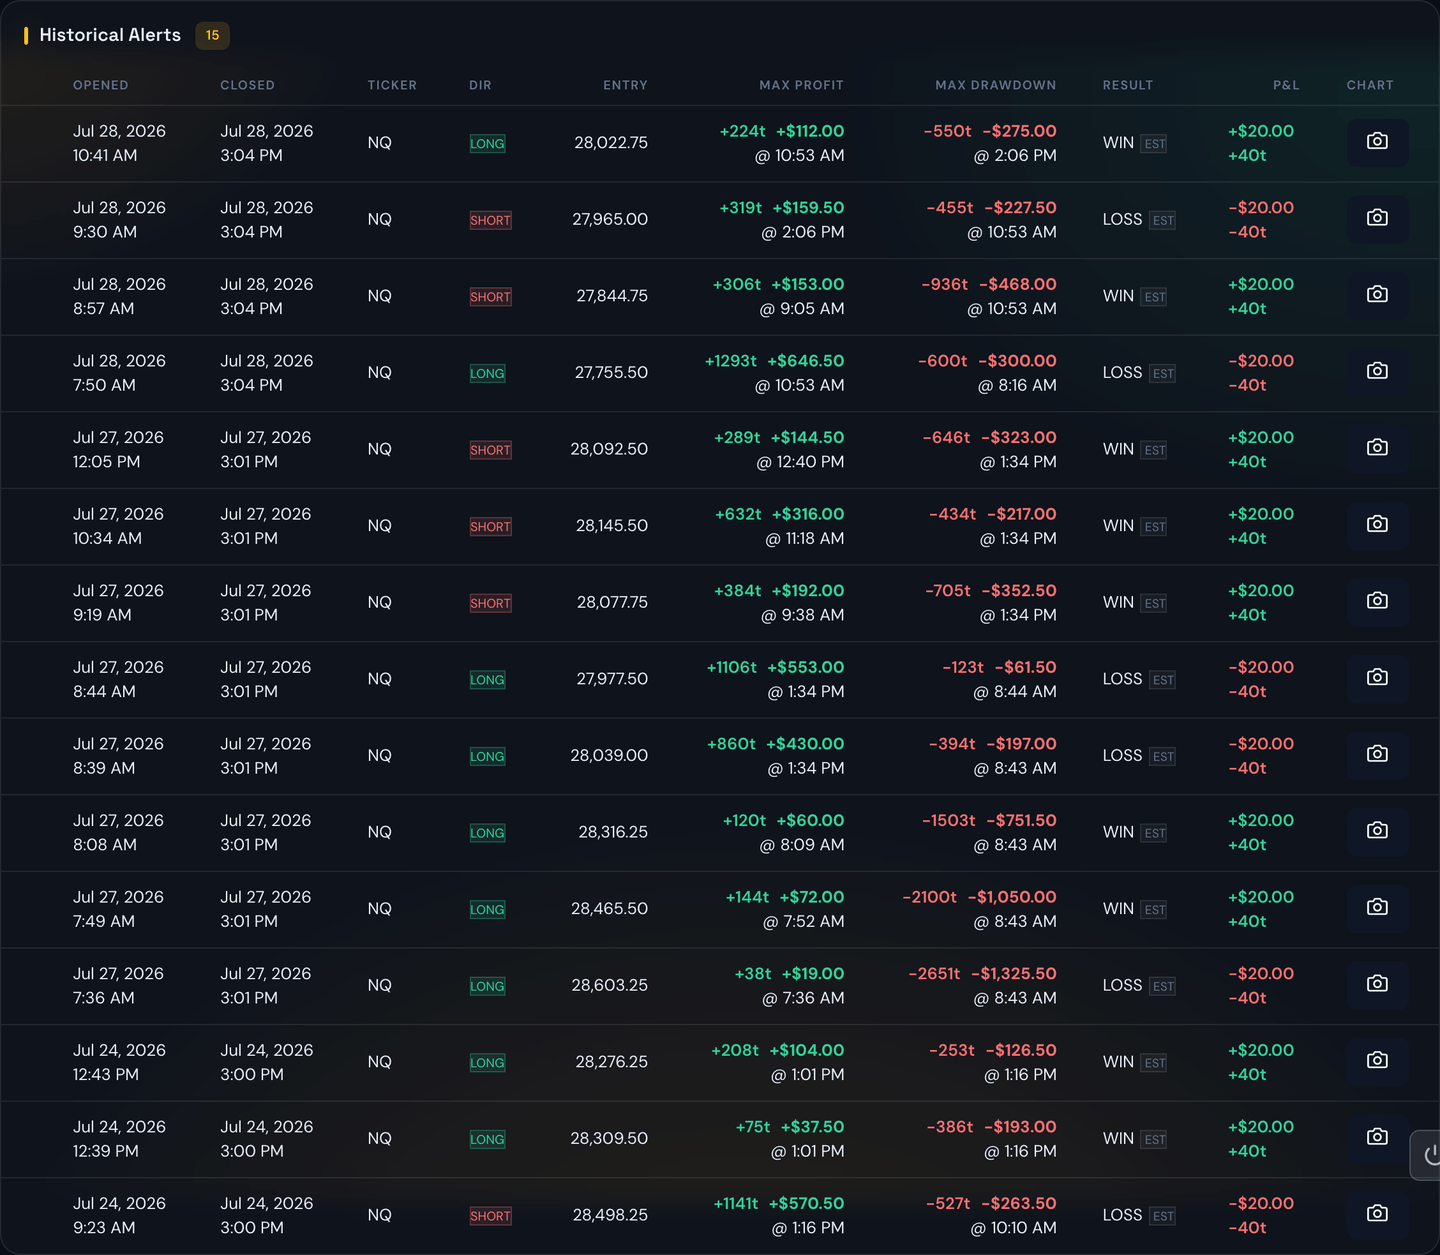
A strategy whose Market is the amber Futures tag trades index futures — NQ, ES, RTY — instead of options. Open one and the detail page changes shape, because almost nothing from the options view applies: a futures contract has no strike, no expiration, no contract type, and most futures strategies signal entries only and never publish an exit price.
So instead of "entry price → exit price," a futures listing reports the two numbers that actually describe how a trade went:
- Max Profit — the best the trade ever got. The furthest price ran in your favor before anything else happened.
- Max Drawdown — the worst it ever got. The furthest price ran against you while the trade was open.
Both are shown in ticks and in dollars, with the time of day each one happened. A tick is the smallest amount a contract can move: on NQ and MNQ a tick is 0.25 points, and four ticks make a point.
Example
A long NQ alert from 11:42 AM shows Max Profit +88t +$44.00 and Max Drawdown −14t −$7.00. In plain English: after that alert, price ran 22 points in your favour — worth $44 on one Micro contract — and at its worst point it was 3.5 points against you, or $7 down.
Choosing your contract and your exits
Above the table, the Futures Simulator replaces the capital-based one. Four settings, and everything on the page recalculates the moment you change any of them:
- Contract — flip between the Micro (MNQ) and the Mini (NQ). A mini is exactly ten times the size of its micro, so this multiplies every dollar figure on the page by ten. Most listings start on Micro, the cheaper of the two.
- Contracts per trade — how many you'd have bought each time.
- Minimum ticks to count a win — your take-profit. How far in your favour a trade had to run for you to have banked it.
- Max ticks drawdown to count a loss — your stop. How far against you a trade had to run before you'd have been knocked out.
Each of those three has ▲ / ▼ buttons next to it, so you can nudge a number up and down and watch the whole page move rather than clicking in and retyping.
Every listing opens on a starting set of these four, chosen to suit the kind of trading it does — a strategy that scalps a few points opens on a tight take-profit and stop, while one that holds for a swing opens on a much wider pair, and on the Mini. Change any of them and the page remembers your choice for that listing next time you visit.
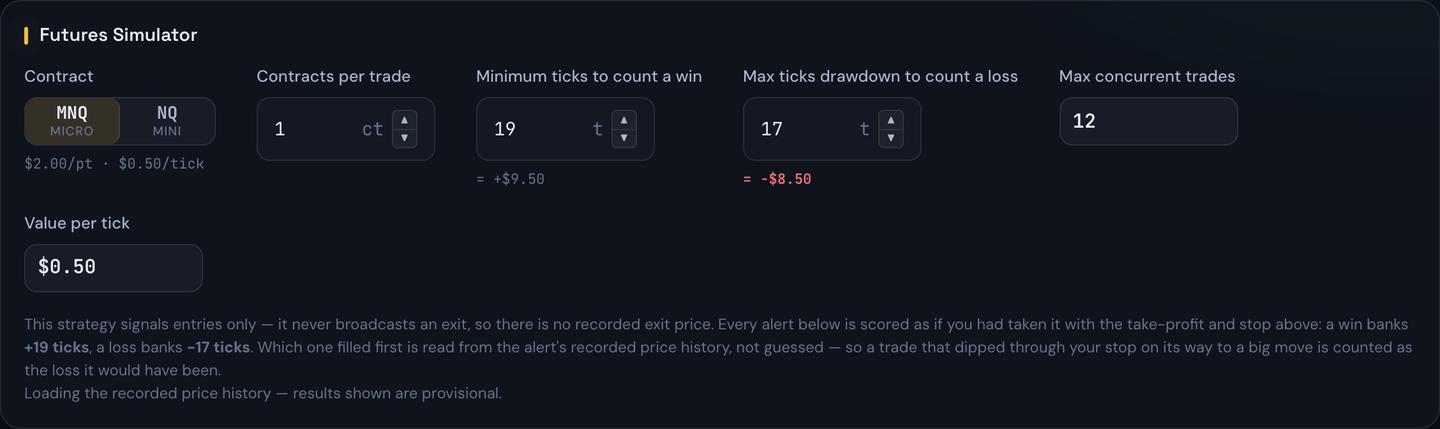
Every alert is then replayed as if you'd taken it with exactly those two exits. A win banks your take-profit; a loss banks your stop. That's what the Win Rate, Total P&L and the equity curve are measuring — not a best case you could never have captured.
The order matters, and the page knows it. A trade that finished up 88 ticks might have first dropped 14 ticks against you. If your stop was 10 ticks, you were never in that trade to enjoy the recovery — and the page counts it as the loss it would have been. This isn't guesswork: the platform recorded the price second by second while the alert was live, and replays it.
Example
Set the take-profit to 40 ticks and the stop to 20, and an alert reads WIN +$20.00. Tighten the stop to 5 ticks and the same alert flips to LOSS −$2.50 — because it dipped 6 ticks before it ever reached your target. Nothing was refetched; the page just re-read the recorded price history.
Letting the page find your settings for you
You don't have to guess at those two numbers. Two buttons — Best win rate and Best total P&L — try every take-profit and stop combination the recorded price history can tell apart, and jump straight to whichever pair scored highest. The result line underneath shows what it found: the win rate, the total, the settings themselves, and the reward:risk of those settings.
That last number is the one to look at hardest. The search maximizes the bottom line, and on a short track record the bottom line can sometimes be maximized by aiming for a tiny profit behind a stop so wide it almost never gets hit. That looks wonderful on paper and hurts badly the first time the stop does get hit — so if the reward:risk comes back well under 1, the page says so plainly.
Warning
These buttons find the settings that would have worked best on trades that have already happened. That is not the same as the settings that will work best on the next one. Use the answer as a starting point, then look at a few rows' profit ladders to check the stop it picked has real breathing room — not that it just happened to squeak past the worst dip in the record.
Example
Click Best total P&L and it lands on 24t / 15t with a reward:risk of 1.60:1 — you're aiming to make more than you're risking, which is a sensible shape. Click Best win rate instead and it might offer 6t / 40t at a 97% win rate: almost every trade "wins," but at 0.15:1 you're risking nearly seven times what you're trying to make, and one loss wipes out many wins.
Reading the profit ladder
Hover over any row's Max Profit and the full ladder pops up — the same card the Discord alert posts, in points, with the mini and micro dollar values side by side. Or click the ▸ arrow at the left of the row to pin it open. Either way you get each profit level the trade reached, and the worst drawdown it had endured by the time it got there:
+40t   +$20.00     worst drawdown    −6t   −$3.00
+88t   +$44.00     worst drawdown   −14t   −$7.00   peak
Read top to bottom, this tells you whether a big winner was a comfortable ride or a white-knuckle one. Two strategies can both show "+88 ticks" and be completely different trades: one that never went more than 3 ticks against you, and one that nearly stopped you out twice on the way. The ladder is where you see which is which — and it's the fastest way to pick a stop that survives this strategy's normal wobble.
Futures result pills
- WIN / LOSS — your take-profit or your stop was reached, in that order.
- TIME — neither one was ever reached. The trade simply ran until the platform stopped tracking it, and the P&L shown is what it was worth at that moment.
- EST — no second-by-second price history was recorded for that alert (usually an older one). Max Profit and Max Drawdown are still accurate; what's estimated is which came first, worked out from the times the high and the low occurred.
Note
There's no Max Capital Per Trade on a futures listing, and no required-capital figure. Futures are sized in contracts, not dollars, and how much cash your broker wants you to hold per contract is set by the broker — not by the strategy. See Futures Strategies for what each contract is worth and how to actually run one.
Live versus static sources
A strategy that's currently live (still publishing alerts) shows real-time prices on its Open Positions. A strategy that's been retired or paused still shows its historical record, but no live updates.
Tip
The detail page is the right place to kick the tires before you subscribe. Look at the equity curve at your preferred sizing, scroll the historical trade list to spot streaks of losses, and decide whether that pattern is something you could sit through.