
The History page is your complete trade journal. Every position that has ever closed — winner or loser, automated or manual — lives here.
What you see
Trades are grouped by date, newest first. Each row shows you:
- In and Out — the date and time the position was opened and closed.
- The ticker, direction, and strike (e.g. SPY 450 Call), with a small C or P badge marking a call or a put.
- Entry and exit prices.
- Quantity of contracts.
- Result — win, loss, or break-even.
- Profit/Loss in dollars and percent.
- Exit reason — profit target hit, stop-loss hit, time limit, or closed manually.
- Source — whether the trade came from an automated alert or you placed it by hand.
In and Out times
Both columns show a date above the time, always in your own timezone — whatever your computer or phone is set to. You never have to convert from New York time in your head.
The date matters more often than you'd think. A trade you held overnight closes on a different day than it opened, and the row makes that obvious at a glance instead of leaving you to wonder how a position went in at 7:50 PM and out at 1:51 PM.
Example
A swing trade opened Monday evening and closed Tuesday lunchtime reads Aug 10 / 7:50 PM under In and Aug 11 / 1:51 PM under Out. Two different dates, so you immediately know it was held overnight.
Note
If a date and time can't be determined for a trade, the column shows a dash (—) rather than guessing.
Spreads in the ticker column
A spread has several legs, so there's no single contract to name. Instead the row shows the underlying, the expiration, and the name of the structure — for example XSP on the top line and 8/15 Iron Condor underneath. The colored spread pill and the 4 legs button sit below it as usual; click the legs button to see every strike. See Spread Trades for what each structure means.
The summary header
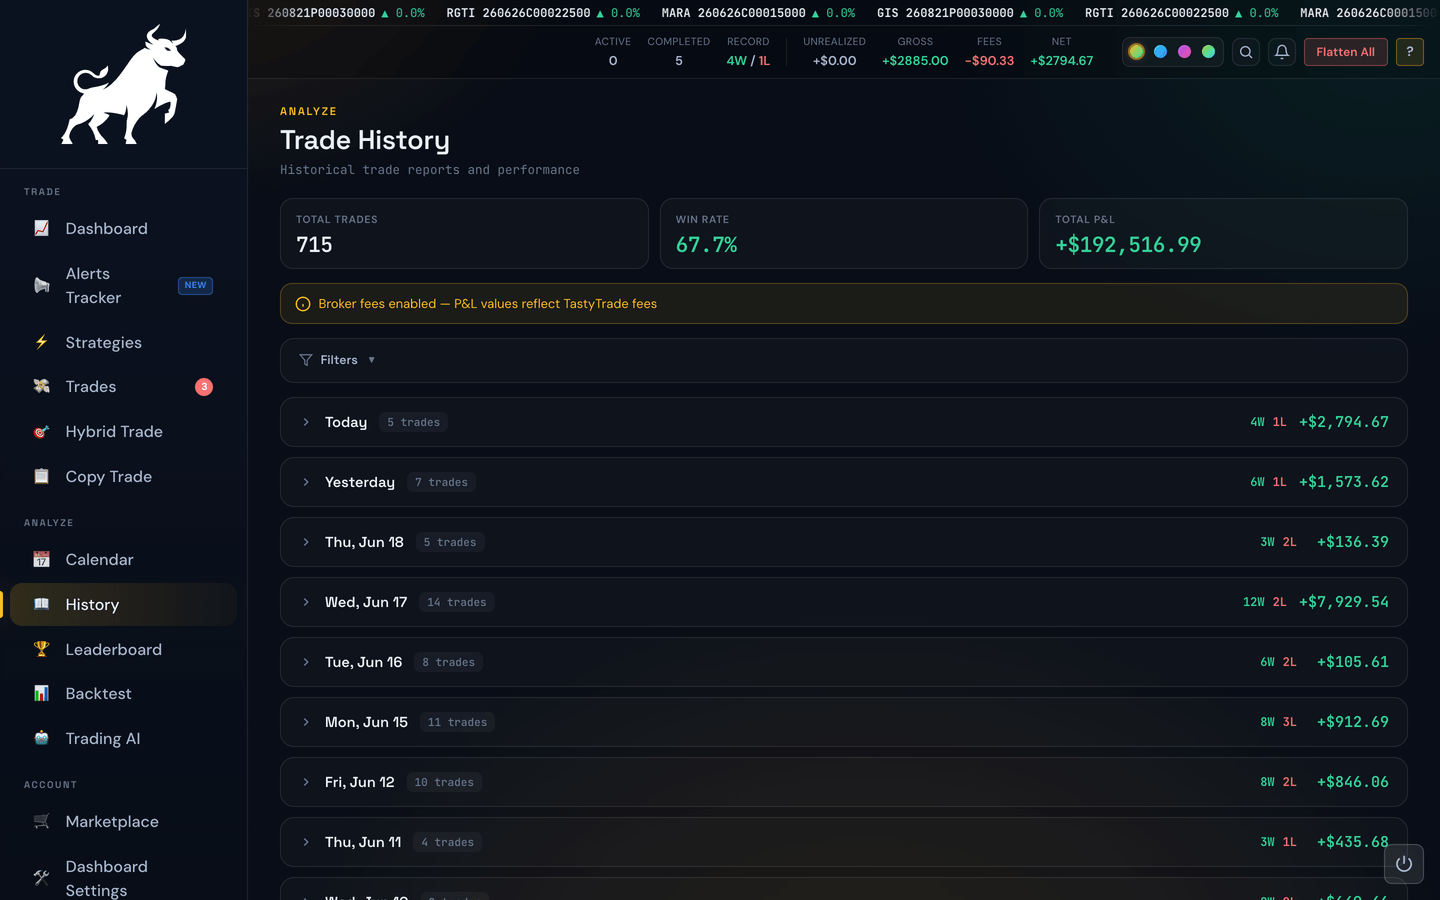
At the top of the page is a quick summary of the trades currently visible: total trades, win rate, total profit, and total fees. Whenever you change a filter, this summary updates with it.
Filtering
The filter panel collapses by default. Click Filters to expand it; if any filters are already active you'll see a count badge on that button. Clear All resets every filter at once.
Inside the panel you can narrow your history by:
- Date range — From and To inputs. Pick a precise window when "Month" or "Year" isn't specific enough.
- Strategy — chips you click to include or exclude each strategy. Multi-select.
- Signal source — chips for each alert source (Dope Spreads, Signal-Hub, marketplace subscriptions, etc.). Multi-select.
- Outcome — Wins, Losses, Breakevens. Pick any combination.
Filters stack — applying more than one narrows the list to trades that match all of them.
Example
To answer "How have my Signal-Hub trades done this month, ignoring break-evens?", set the date range to the first of the month through today, click the Signal-Hub source chip, and click both the Wins and Losses outcome chips.
How the list is grouped
Trades are grouped into per-day accordions, newest day at the top. The header of each day shows the date, the trade count, a wins/losses/break-evens summary, and the day's total P&L (green or red). Click a day's header to expand its trades; click again to collapse. This makes it easy to scan months of history without drowning in rows.
Sorting
Click a column header to sort the trades inside each day. The days themselves always stay newest first. The first click sorts the way you're most likely to want: newest first for In and Out, A to Z for Ticker and Exit Type, and biggest first for the number columns. Click the same header again to flip the order, and a third time to go back to the usual order (latest entry first). A small arrow (▲ or ▼) beside the header shows which column is sorted and which way.
- One sort applies to every day at once, and the app remembers it on this device.
- In and Out sort by the full date and time. A swing trade opened the afternoon before sorts as older than trades opened that morning, even though they're listed under the same day.
- A cancelled trade has no exit, return or P&L, so it sits at the bottom when you sort by those columns, whichever way you sort.
- If you show futures P&L in points or ticks, P&L still sorts by dollar value, because a point is worth a different amount on each contract.
- Export CSV follows your sort, so the file lists trades in the same order as the screen.
- On a phone the column headers are hidden, so use the Sort menu above the list instead. The ▲/▼ button beside it flips the direction.
Example
Open a busy day and click P&L to see your best trade first. Click it again and your worst trade is on top. Its Exit Type tells you whether a stop or an exit signal closed it.
Fees and Net columns
If you've enabled broker fees in Dashboard Settings, the table grows two extra columns: Fees (what your broker took for each trade) and Net (gross P&L minus fees). Turn the toggle off and the columns disappear. See the Fees & Slippage topic for the full story on how fees are calculated.
Drilling into a trade
Clicking a row expands it to show the full lifecycle of that trade: when it opened, the highest and lowest prices it reached, the trailing-stop path (if any), the exact exit, and the fees charged on the way in and out. For spread trades you'll also see the per-leg breakdown — same as the Trades page.
Trade Settings — what the strategy was actually running
A trade's Trade Settings window shows the settings its strategy had at the moment the trade opened, frozen onto the record. That's deliberate: if you widen your stop-loss next week, this window still shows the stop that was really in force when this trade was taken, so an old result always lines up with the rules that produced it.
Every setting the strategy had is listed — budget and risk, profit target and stop-loss, exit legs, trailing rules, filters, trading hours, its own killswitch targets, and the futures settings if it's a futures strategy. Settings that were left unset show a dash.
Two buttons sit at the bottom:
- Save Strategy as Preset — stores those exact strategy settings as a named preset you can load later in the New Strategy panel. The most reliable way to rebuild a strategy that produced a result you liked.
- Save Account Settings — stores the account-wide settings listed underneath instead. Those are different things, which is why they're separate buttons.
Example
A trade from three weeks ago came out well and you want that setup back. Open its Trade Settings, click Save Strategy as Preset, name it "March Winner". Now go to Strategies → New Strategy and click the ⭐ March Winner button — every setting comes back exactly as it was that day.
Note
Trades taken before a setting existed simply won't list it. Nothing is missing from the record; that setting genuinely wasn't part of the strategy yet.
Exporting to CSV
The Export CSV button at the top of the page downloads your trade history as a spreadsheet file (.csv) that opens in Excel, Google Sheets, or Numbers.
It exports exactly the trades you're currently looking at — whatever's left after your filters and the Live/Paper toggle. So if you filter to your OG strategy for last week and click Export CSV, the file contains just those trades, in the same order they appear on screen.
Each row includes the date, entry and exit times, ticker, broker, strategy, how the trade started (Alert, Manual, or Copy), quantity, entry and exit prices, percent return, gross P&L, fees, net P&L, the result (Win / Loss / BE), the exit type, any scale-in and multi-leg exit detail, and whether the trade was broker-verified.
Note
If a trade was reconciled with your broker (a green ✓ Verified), the file uses the broker-verified entry and exit prices — the real fills — not the originally-reported ones. The Fees and Net columns follow your Broker fees toggle in Dashboard Settings: turn fees on to see them filled in.
Tip
Use the filters first to narrow things down, then export — it's the fastest way to pull, say, a single month or a single strategy into your own trading journal or a tax spreadsheet.