
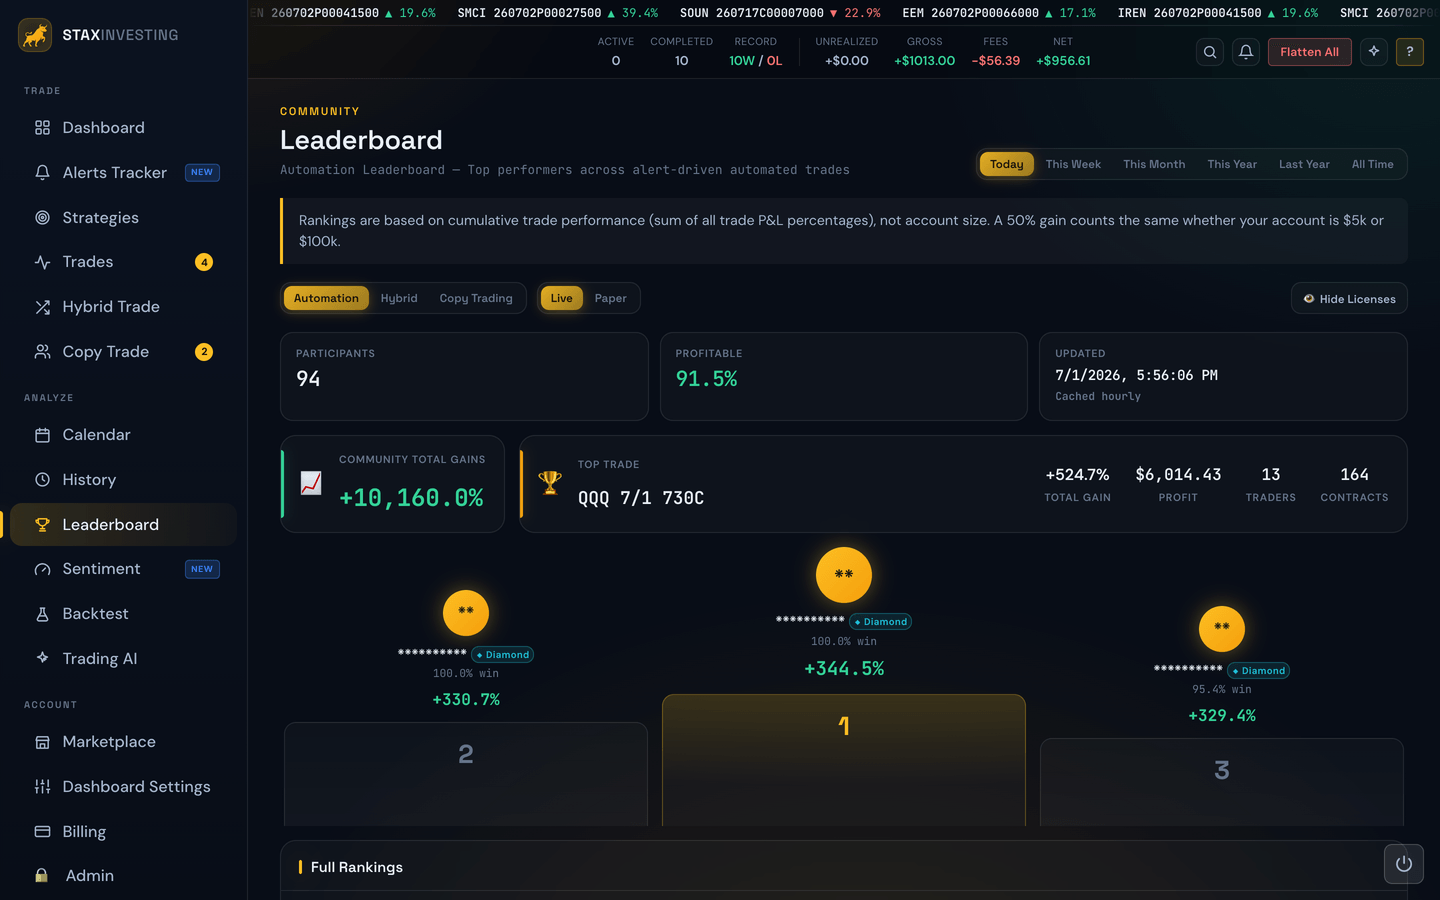
The Leaderboard ranks users by cumulative performance over a chosen period. It's a way to see how your account is doing relative to the wider community of users running the same alert sources.
Choosing a period
A row of tabs (or buttons) lets you switch the period:
- Today — just today's performance.
- 7-Day / Week — the last seven trading days.
- 30-Day / Month — the last month.
- Year-to-date / Last Year — calendar-year views.
- All-Time — every closed trade since the account started.
Choosing a board
A second row of tabs picks which kind of trading is being ranked:
- Automation — trades your bot took automatically from an alert.
- Hybrid — trades you placed by hand from the platform.
- Strategies — the strategies themselves, rather than the people trading them.
- Competition — the current trading competition, if one is running.
Filtering by signal source
On the Automation tab, a row of buttons underneath the tabs lets you narrow the board to a single signal source — so you're comparing people who traded the same alerts as you, instead of everyone lumped together.
Leave it on All Sources to see the whole community, or click any source to rank only the accounts trading it.
This matters because different sources behave very differently. Some are entry-only — they tell you when to get in and leave the exit entirely to your own settings — while others call both the entry and the exit. Blending them into one ranking hides that difference. See Signal Sources for what each one does.
For example: say you subscribe to Nexus Quantum Pro - Options, but most of the community trades the older StaxInvesting sources. On All Sources you're being ranked against hundreds of accounts trading alerts you never took, and your position tells you very little. Click Nexus Quantum Pro - Options and the board rebuilds using only trades from that source — now you can see whether your settings are getting more out of those same alerts than the next person's.
A few things worth knowing about this row:
- It only lists sources that actually traded in the period you're looking at. Switch from All-Time to Today and the buttons change, because a source that called nothing today has no results to rank. The source you currently have selected always stays clickable, even if it was quiet — so you're never left on a filtered board with no way back.
- The heading tells you what you're looking at. When a source is selected, the text above the table names it, so a filtered board can never be mistaken for the full one.
- It doesn't change your trading. This is a viewing filter and nothing more — it doesn't affect your strategies, your subscriptions, or which alerts you receive.
Tip
Compare a source's board against the same source in the Marketplace before subscribing to something new. The Marketplace shows how the signal performed; the leaderboard shows what real accounts actually got out of it after their own settings, fills, and fees. The gap between those two numbers is usually the interesting part.
On the Copy Trading tab you'll see a similar row, listing the traders you can copy rather than signal sources.
The Strategies board
Every other board ranks traders. The Strategies tab ranks the strategies — one row per strategy, scored on the trades it called, with no account, settings, or fills in the picture at all.
It answers a different question. The Automation board tells you how people did trading a source; the Strategies board tells you how the source itself did. Those two numbers are rarely the same, and the gap between them is usually your settings.
Rows are named — this board shows the strategy's name where the others show Trader #4, because a strategy isn't a person and there's nothing to keep anonymous. You'll see its Total % Gain, Win Rate, and whether it finished the period green or red.
For example: you're deciding between two strategies to follow. Open This Month on the Strategies tab and you can see both side by side — say one is up 42% on 18 called trades at a 61% win rate, and the other is up 51% on 3 trades. Same period, same scoring, and now the second one's bigger number looks a lot less convincing than it did on its own listing.
A few things worth knowing:
- There are no dollar figures on this board, and that's deliberate. It scores what was called, not what anyone banked. Two strategies calling identical trades in different position sizes would rank on size instead of on skill, so the board sticks to percentages and everyone competes on the same footing.
- A strategy only appears once it has called a trade in the period. Switch from All-Time to Today and quiet strategies drop off, exactly like the signal-source buttons above.
- The Live/Paper buttons don't apply here (if you have them). Those filter by which account placed a trade, and this board isn't looking at accounts.
Tip
Read this board next to Marketplace rather than instead of it. The Marketplace shows you a strategy's full listing and history; this ranks every strategy against every other one over the same window, which is the comparison a listing page can't give you on its own.
Sorting
Click any column header to re-sort the table, including Rank, Trader (or Strategy) and Status. The first click sorts the way you're most likely to want: top rank first for Rank, A to Z for names, profitable first for Status, and highest first for everything else: percentages, dollars, fees, win rate and copiers. Click the same header again to flip the order, and a third time to go back to the official ranking. A small arrow (▲ or ▼) beside the header shows which column is sorted and which way.
- Accounts that haven't closed a trade yet stay at the bottom whichever way you sort. They aren't in last place; they just haven't been placed yet.
- Switching to a different board puts the table back in rank order.
Example
Click Win Rate to see who is right most often, then click Copiers to see which strategies people trust with their money. Click Copiers twice more and you're back to the official ranking.
The podium
The top three accounts for the chosen period are highlighted on a podium above the table — second place on the left, first in the center (raised highest), and third on the right — so the leaders stand out before you even read the table. The podium always shows the top three by rank, however you've sorted the table below it.
Tier badges
Every ranked row carries a small tier badge based on its standing: Diamond (top 5), Platinum (6–15), Gold (16–50), Silver (51–150), and Bronze below that. It's a quick shorthand for how high up the board a row sits.
Copiers
On boards where the data is available, a Copiers column shows how many people are copying that strategy. Like every other column it's sortable, so you can rank by popularity as well as by performance.
Totals row
Pinned to the very bottom of the table is a totals row that sums up the whole board for the filters you've applied. The dollar and count columns — Gross P&L, Fees, Net P&L, Trades, and Copiers — are added together, while the percentage columns (Total % Gain and Win Rate) show the average across the ranked accounts, labeled avg (adding up percentages wouldn't tell you anything useful). It recalculates on the fly whenever you change the period, source, or any other filter, so it always matches exactly what's on screen.
Who appears on the board
The leaderboard ranks active members only — anyone with a current subscription, plus lifetime members (who never lapse). If someone cancels, they stay on the board through the end of the period they've already paid for, then drop off once that period ends — so the rankings always reflect the community that's trading alongside you right now, not accounts that left months ago.
Dropping off the board only affects the ranking. Your own trades are always kept and still counted in your personal stats and history — nothing about your records changes.
For example, a trader who had a huge all-time run but cancelled last quarter won't sit at the top of the All-Time board anymore — you're always being compared against people who are still in it with you. A lifetime member, on the other hand, is always included.
The Competition board
During a trading competition an extra Competition tab appears. It works differently from the others in two ways.
Entrants are shown by name. Everywhere else the board is anonymous, but a competition is public by design — entrants signed up knowing their handle would appear — so the Competition tab shows the handle each entrant registered with. It still never shows a license or any account detail, and it only lists entrants who have actually closed a trade in the period you're looking at.
It's scored differently. The Competition board ranks on a Score:
Score = Net % − ( 0.5 × Max Drawdown % )
Everything is measured in percentages, never dollars. You're judged on the quality of what you called, not on how many contracts you traded — so a big account and a small one compete on exactly the same footing.
Max Drawdown is the worst peak-to-valley drop on your running total across the whole competition — not the worst single trade. If you climb to +150%, slide back to +60%, then finish at +200%, your drawdown is the 90% you gave back along the way.
So two entrants who both finish at +200% don't tie. One who never gave back more than 20% scores 190%; one who round-tripped 90% scores 155%. Making the gains smoothly beats making the same gains on a rollercoaster — which is the whole point, since a trader nobody can stomach following isn't worth following.
Tier badges are hidden on this board (a competition field is too small for them to mean anything), and the totals row shows the worst drawdown in the field rather than a sum, since adding everyone's drawdowns together would describe a curve nobody actually traded.
Seasons, and what happens when one ends
Competitions run in seasons. When a season ends, its standings are locked — the board is stamped FINAL with the date it closed, and the numbers never move again.
Locked really does mean locked. Anything that happens after the closing bell is invisible to that season, including a position you were still holding when it ended:
- A trade you closed during the season counts at the price you actually got out.
- A trade you were still holding at the closing bell is valued at its price as of that bell, and that value is frozen in. If you keep holding it and close it days later for twice as much — or for nothing — the season's standings don't change.
For example, if you were short a spread into the final Friday and it was worth $0.40 to buy back at the close, the season scores it at $0.40. Riding it into the following week can't improve or damage your finish.
Once more than one season exists, buttons above the board let you switch between them. Past seasons stay available permanently, so you can always go back and look at how a previous season finished — and if you competed in more than one, each of your finishes stays on record.
Note
Entering trades for a finished season isn't possible — the entry is closed along with the standings. Your ordinary trading is completely unaffected; only the competition entry retires.
What's NOT shown
Other than the Competition board described above, the leaderboard never shows other users' usernames, license details, or anything personally identifying. You can see how everyone is doing in aggregate, but you can't tie a row back to a specific person.
Tip
The leaderboard is the easiest way to sanity-check your own settings. If the median user is up 8% this month on the same alert source you subscribe to and you're down 3%, your settings — not the alerts — are probably the issue. Time to backtest.